

How to Guide: Read my Fidelity Statement
 They come every month, but what do all the numbers mean, and how can I make sense of it all? In this article, we will explore the ins and outs of our Fidelity statement, and by the end, we’ll have a better understanding of what we’re looking at. We’ll start by going over the three main categories that your statements are in.
- Account Summary
- Holdings
- Activity
The Accounts Summary portion will provide information about your account’s value, including beginning and ending values. The Holdings section will categorize your investments so that they’re all in one location, as well as list their prices, quantities, and market values. Lastly, the Activity section will show any purchases and sales that were made since your last statement, including the amount of shares bought and sold, as well as dividends and interest received on your investments.
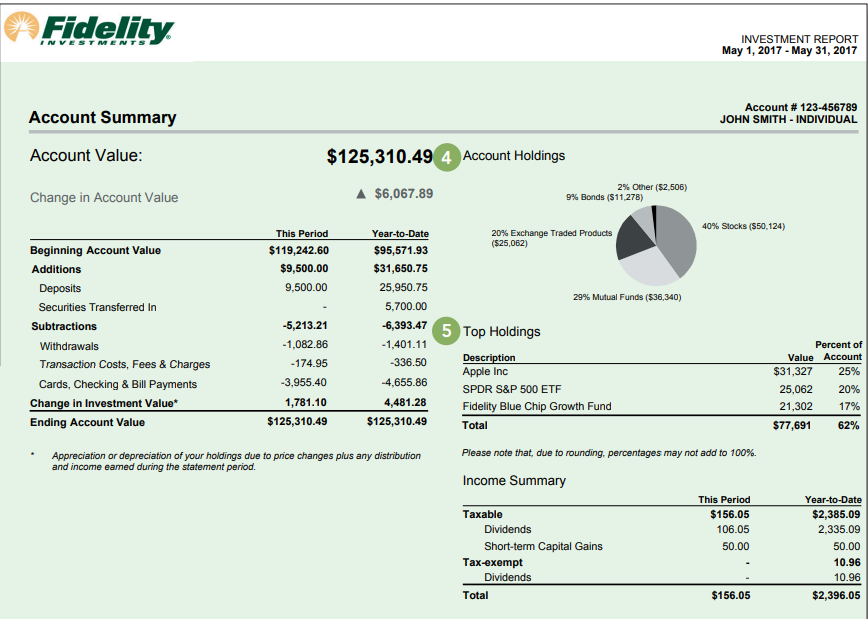
Now, let’s dive a little deeper into each section so that you know where on the statement to find all of this information. In the Account Summary section, you’ll be able to get a high-level view of your account and its value during the statement period. This is where you’ll find items such as beginning and ending values for the period, the Year-to-Date beginning and ending values, the type of account (such as an IRA or Individual Account, located at the top right), and a list of your top holdings.
The beginning and ending values are based on specific dates and include the account activity that occurred during the statement period. The statement period is located at the top left of each page. To determine the ending value, Fidelity adds and subtracts amounts from the beginning value based on deposits, withdrawals, transaction costs, fees and charges, and market appreciation/depreciation during the statement period. You’ll also be able to see Year-to-Date beginning and ending values located just to the right of the monthly numbers. The account summary also shows your top holdings in your account. Included is a sample statement of what the Account Summary page looks like so that you can get a feel for where to find this information.
The next section of the statement details our holdings. The holdings are broken down into sub-classes that show the different types of holdings you have in the account. Some common examples would be:
- Core Account - Opening a Fidelity account automatically establishes a core account, which is needed for processing cash transactions. It’s a position in your account that acts like a wallet. As money grows in this account from dividends and interest payments, it can then be used to purchase additional assets in your account and keep your money working for you.
- Exchange Traded Products - These primarily consist of your ETFs (Exchange Traded Funds). ETFs are a basket of securities that can be purchased and sold throughout the day.
- Stocks - These would be individual company stocks that you own, such as Apple, Amazon, Microsoft, etc.
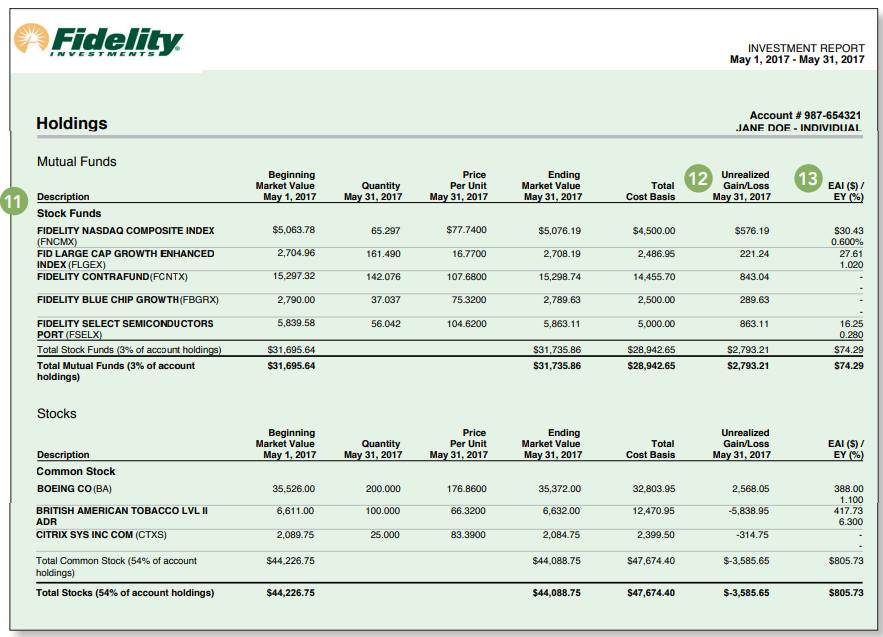
In the holdings section of the statement, it breaks each individual sub-class into quantity owned, price per unit, and total market value. This section will also show your cost, or cost basis, and unrealized gain/loss. You may not be too familiar with all of this, so here’s a brief description: Your cost or cost basis is the original value of an asset when purchased. Your unrealized gain(loss) is the difference between your original purchase price of the asset (Cost Basis) and how much that asset has increased (or decreased) from the date of purchase. Depending on the type of account you have, those Unrealized gains will be either taxed at ordinary income, short-term capital gains, long-term capital gains, or possibly not taxed at all! The last section to the far right shows your estimated annual income (EAI) and estimated yield (EY). The estimated annual income is an estimate of the annual income for a specific security position over the next rolling 12 months. The estimated yield is calculated by dividing the current EAI for a security position by its statement closing date market value. Please note that EAI and EY are estimates only and may include the return of principal and/or capital gains, which would render them overstated. Actual income and yield might be lower or higher than the estimated amount. See below for a sample statement detailing the holdings portion.
The last section of the statement goes over the activity for the month. Your account transactions are grouped together by activity type. This may include items such as:
- Trades pending settlement
- Securities bought and sold
- Dividend, interest, and other income
- Fees and charges
- Core fund activity
This section shows the trade date, settlement date, security name, description (buy or sell), purchase price, and total amount. See below for an example of what this section looks like in your monthly statement.
I hope that this article will help you navigate your monthly statement moving forward. Although this information is key in understanding where your account values are, it’s also important to keep the big picture in mind, which includes your long-term goals and the investment strategies that are in place to achieve those goals. We all like seeing our investments continue to increase month after month, but we know that markets don’t always behave the way we’d like. There will be some down months, but that’s the sign of a healthy market, and it’s important to keep that in mind so that we stay positive during our overall investing journey!
Bonus Material!
I also want to take a moment to discuss Going Green! If the mail seems overwhelming with the statements and other materials coming in, Fidelity has the option to go paperless and receive your statements and other materials electronically. To do so, simply log in to your Fidelity NetBenefits account, then proceed to your profile. From there, go to Personal and Contact Information to make sure you have an email address set up, and then go to Communication and select “Yes” next to Statement Notifications. You can change your delivery method at any time by visiting NetBenefits or by calling Fidelity directly. That’s it; you’ll now be set up for paperless use!
Written by Joel Hoffman